
Seat Belt Use Evaluations
Alaska 2017 Seat Belt Use Report
A total of 44,739 vehicles were observed during the 2017 study period. Seat belt use was recorded for drivers and front seat outboard passengers in cars, trucks, SUVs and vans. There were 56,015 occupants observed, excluding unknowns (n = 172). The results of this study indicate that 90.1% of Alaska drivers and passengers were using a seat belt during the study period.
Alaska 2016 Seat Belt Use Report
A total of 37,539 vehicles were observed during the 2016 study period. Seat belt use was recorded for drivers and front seat outboard passengers in cars, trucks, SUVs and vans. There were 45,543 occupants observed, excluding unknowns (n = 12). The results of this study indicate that 88.5% of Alaska drivers and passengers were using a seat belt during the study period.
Buckle Up 2016 Report
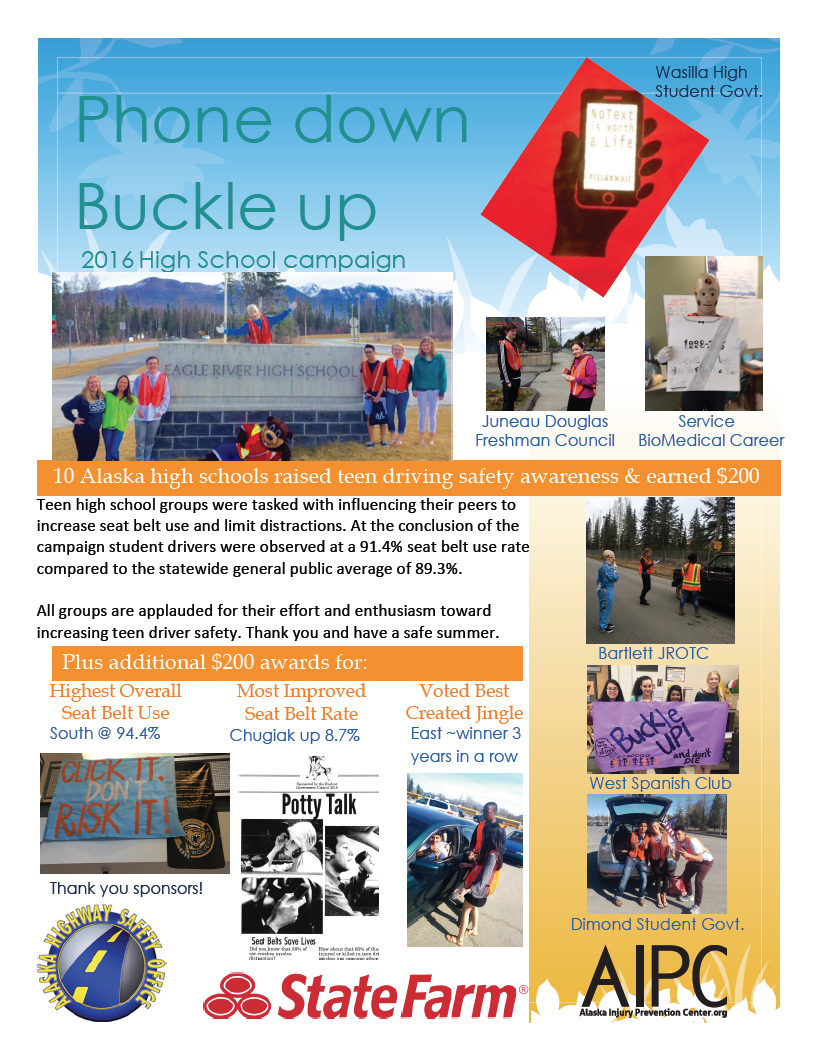
Ten Alaska high schools raised teen driving safety awareness and earned $200. Teen high school groups were tasked with influencing their peers to increase seat belt use and limit distractions. At the conclusion of the campaign student drivers were observed at a 91.4% seat belt use rate compared to the statewide general public average of 89.3% All groups are applauded for their effort and enthusiasm toward increasing teen driver safety.
Alaska 2015 Seat Belt Use
In accordance with the NHTSA’s Uniform Criteria for State Observational Surveys of Seat Belt Use as published in 2011, Alaska Injury Prevention Center (AIPC), under a grant from the Alaska Highway Safety Office, conducted seat belt observations for 2015. A total of 35,256 vehicles were observed during the 2015 study period. Seat belt use was recorded for drivers and front seat outboard passengers in cars, trucks, SUVs and vans. There were 47,800 occupants observed, excluding unknowns (n = 94). The results of this study indicate that 89.3% of Alaska drivers and passengers were using a seat belt during the study period.
Buckle Up 2015 Report
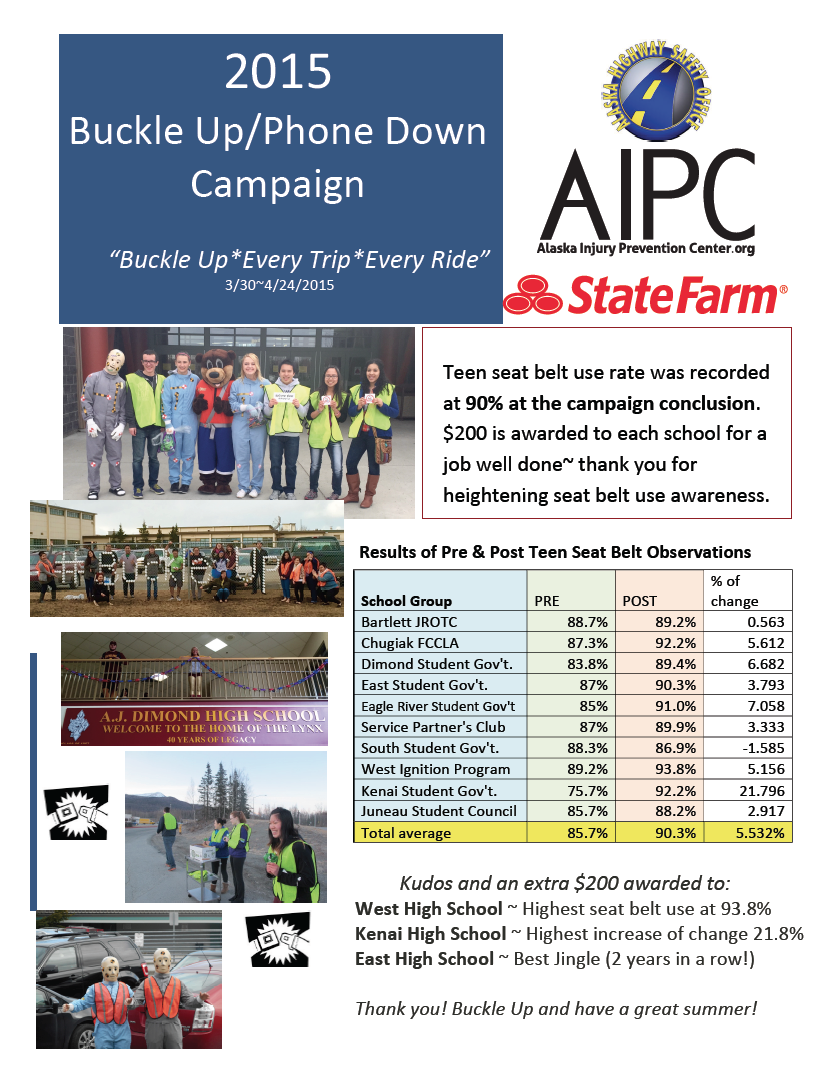
At the conclusion of the 2015 Buckle Up Campaign, 90.3% of students were observed to be buckled up.
Alaska 2014 Seat Belt Use

This observational study assessed 2015 driver and front row outboard passenger seat belt use in Alaska. The National Highway Traffic Safety Administration (NHTSA) requires observational surveys to be completed annually in each state to determine the level of seat belt use for each state. In accordance with the NHTSA’s Uniform Criteria for State Observational Surveys of Seat Belt Use as published in 2011, Alaska Injury Prevention Center (AIPC), under a grant from the Alaska Highway Safety Office, conducted seat belt observations for 2015. The 2015 observations took place from June 1-9, 2015 in the Anchorage, Fairbanks, Juneau, Kenai, and Matanuska-Susitna regions. Observation sites were selected according to the NHTSA’s criteria based on data from the Alaska Fatality Analysis Reporting System and Alaska Department of Transportation & Public Facilities. A total of 35,256 vehicles were observed during the 2015 study period. Seat belt use was recorded for drivers and front seat outboard passengers in cars, trucks, SUVs and vans. There were 47,800 occupants observed, excluding unknowns (n = 94). The results of this study indicate that 89.3% of Alaska drivers and passengers were using a seat belt during the study period.
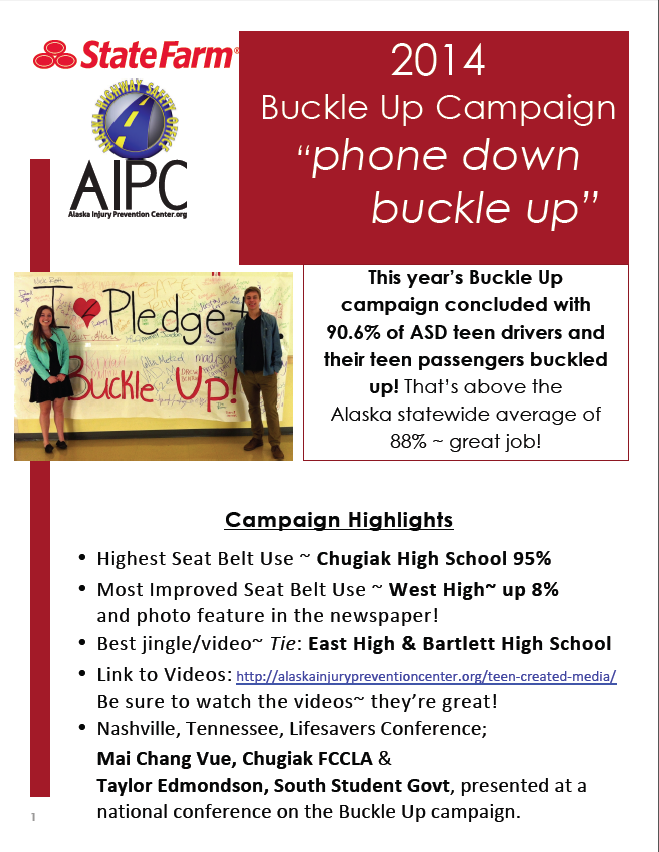
High School Buckle Up 2014
Alaska Observational Surveys of Seat Belt Use 2013
The National Highway Traffic Safety Administration requires observational surveys to be completed annually in each state to determine the level of seat belt use. From 2004 – 2013, the Alaska Injury Prevention Center (AIPC), under the direction of Ron Perkins, conducted the observational surveys under a grant agreement with AHSO. The 2013 observations took place from June 3–12, 2013. Seat belt use was recorded for drivers and front seat outboard passengers in passenger cars, trucks, SUVs, and vans. A total of 38,652 vehicle occupants: 30,721 drivers and 7,931 outboard passengers were observed. The total share of occupants wearing seat belts for Alaska in 2013 (excluding “unknowns”) was 86.1 percent. This is a 2 percentage point decrease over the observed rate in 2012. The observation sites were the same as last year per the plan approved by NHTSA.
High School Buckle Up 2013
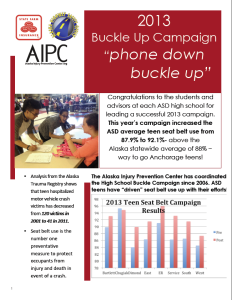
Summary
Analysis from the Alaska Trauma Registry shows that teen hospitalized motor vehicle crash victims has decreased from 120 victims in 2001 to 41 in 2011. Seat belt use is the number one preventative measure to protect occupants from injury in event of a crash. All schools ran successful Buckle Up Campaigns; increasing Anchorage teen seat belt usage from an average of 87.9% pre campaign to 92.1% after the campaign. The Alaska state average is 88%.
Alaska Observational Surveys of Seat Belt Use 2012
Summary
The 2012 observations took place from June 4–13, 2012. Seat belt use was recorded for drivers and front seat outboard passengers in passenger cars, trucks, SUVs, and vans. A total of 33,111 vehicle occupants: 26,295 drivers and 6,816 outboard passengers were observed. Of the 33,111 occupants, seat belt use could not be determined for 487 or 1.5% of the total observations. Thirty-five percent (30%) of the observed vehicles were cars, 31% sport utility vehicles (SUV), 31% trucks, and 8% were vans. The total share of occupants wearing seat belts for Alaska in 2012 (excluding “unknowns”) was 88.1 percent. This is a 1.2 percentage point decrease over the observed rate in 2011.
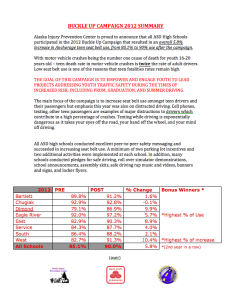
High School Buckle Up 2012 Final Report
Summary
All ASD high schools conducted excellent peer-to-peer safety messaging and succeeded in increasing seat belt use. A minimum of two parking lot incentives and two additional activities were implemented at each school. In addition, many schools conducted pledges for safe driving, roll over simulator demonstrations, school announcements, assembly skits, safe driving rap music and videos, banners and signs, and locker flyers. The 2012 Buckle Up Campaign resulted in an overall 5.8% increase in Anchorage teen seat belt use, from 85.1% to 90% use after the campaign.
Alaska Observational Surveys of Seat Belt Use 2011
Alaska Observational Surveys of Seat Belt Use 2010
Key Findings
The surveyors observed a total of 26,731 vehicle occupants (21,339 drivers and 5,392 outboard passengers) in 2010. Thirty-five percent (35%) of the observed vehicles were cars, 32% sport utility vehicles (SUV), 26% trucks, and 7% were vans. During the 2010 observation period in Alaska, the weighted data showed that 87.4 percent of the drivers and 84.6 percent of the outboard passengers were wearing seat belts. The total proportion of occupants wearing seat belts was 86.8 percent. Trucks were the third largest vehicle category and once again had the lowest, although improved, usage rate at 82.2%. There were 564 motorcycles (611 riders) in the sample, with 74.1% of the drivers and 80.9% of the passengers wearing helmets. Motorcycle passengers helmet usage in 2010, dropped by 16% from previous years.
Alaska Seat Belt Observation Surveys 2009
Key Findings
The surveyors observed a total of 37,807 vehicle occupants in 2009. Thirty-five percent (35%) of the observed vehicles were cars, 28% sport utility vehicles (SUV), 26% trucks, 8% were vans, and 3% were motorcycles. During the 2009 observation period in Alaska, the weighted data showed that 86.6 percent of the drivers and 84.1 percent of the outboard passengers were wearing seat belts. The total proportion of occupants wearing seat belts was 86.1 percent. Trucks were the third largest vehicle category but had the lowest usage rate at 80.6%. There were 895 motorcycles (936 riders) in the sample, with 72.8% of the drivers and 97.6% of the passengers wearing helmets.
Alaska Seat Belt Cost Analysis
Key Findings
During the time period analyzed, medical costs for those who were not wearing a seat belt at the time of the crash totaled $13 million. Of this amount, 50% was paid for with public funds. Victims of crashes in Alaska spent a cumulative average of 2,672 days in the hospital each year. The majority of these individuals – 58% – were unrestrained at the time of the crash. Medicaid costs to treat 83 crash victims under the age of 20 totaled $1.6 million. Post-hospitalization care for victims of motor vehicle crashes is also expensive. Nineteen crash survivors were placed in “skilled nursing facilities” at a cost of $1 million, of which 77% was paid by public sources. Of those 19 individuals, 13 were not wearing a seat belt at the time of their crash.